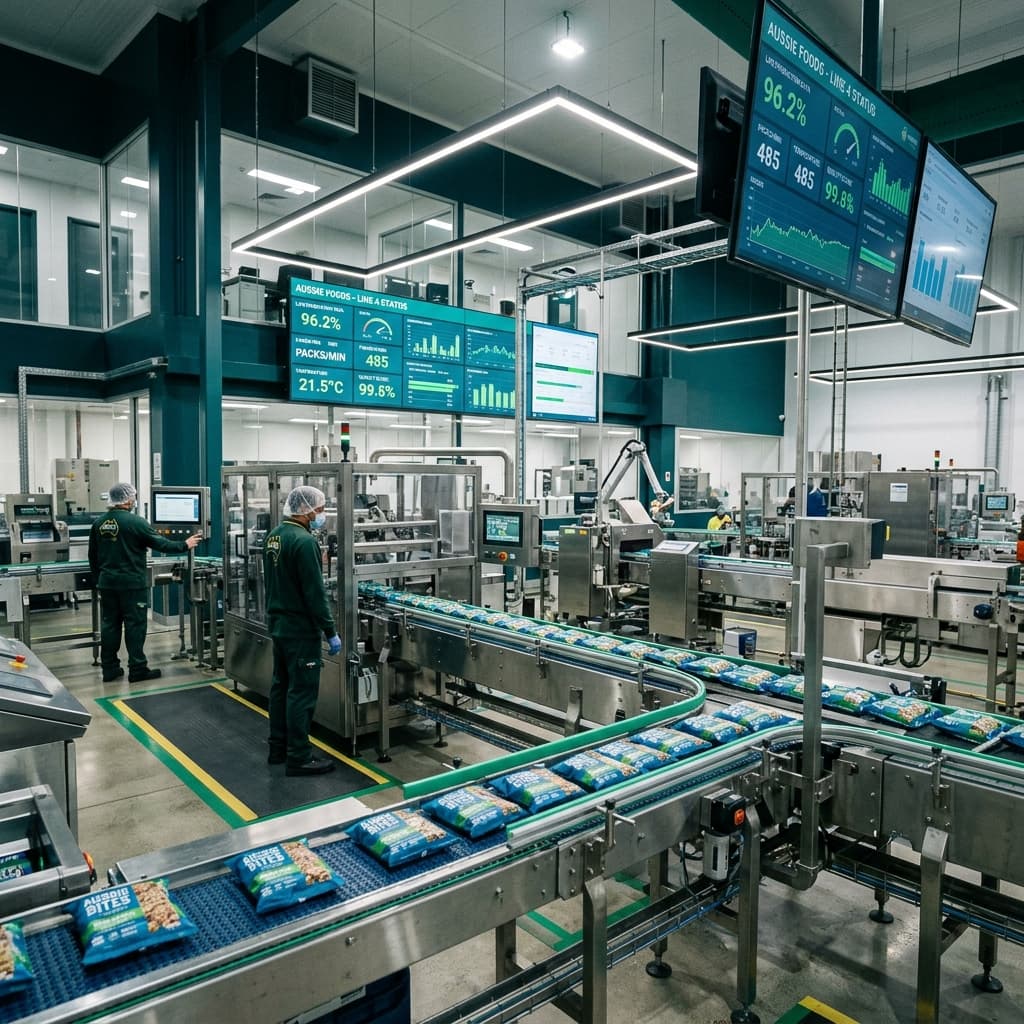
Australia's food and grocery manufacturing sector remains the bedrock of the national industrial economy. Accounting for over 33% of all Australian manufacturing jobs and employing more than 301,000 workers across capital cities and regional hubs, the sector is currently navigating one of the most complex economic periods in modern history.
According to recent data published by the Australian Food and Grocery Council (AFGC), industry turnover has reached an impressive $182.6 Billion, with agricultural food exports expanding by 17.4% to $52.6 Billion. However, behind these headline figures lies an operational reality defined by persistent margin compression, volatile wholesale energy contracts, escalating raw material input costs, and shifting consumer purchasing habits.
To achieve the industry's strategic target of $250 Billion in turnover by 2030, Australian food and beverage manufacturers cannot simply rely on volume expansion. Manufacturers must execute rigorous internal operational transformation, eliminate raw material wastage, and digitize yield tracking.
The 2026 State of the Industry: Growth vs. Margin Compression
The Australian food manufacturing sector operates in a high-cost environment. While global food demand continues to rise—particularly across high-growth Asian markets—domestic food processors face structural overheads that require exceptional operational efficiency.
Capital investment across Australian food processing plants rose by 16% to $4.5 Billion, signaling that business owners are actively investing in facility modernization. Yet, gross operating margins across mid-tier food plants have compressed by an average of 3.2% to 4.8% over the past 24 months.
Key Factors Driving Margin Squeeze in 2026:
- Wholesale Energy Contract Surges: Industrial electricity and natural gas rates across New South Wales, Victoria, and Queensland have spiked, making thermal processing and industrial refrigeration significant P&L liabilities.
- Ingredient Price Volatility: Local climate variability alongside international shipping disruptions have introduced unpredictable spot-market pricing for core inputs like vegetable oils, sweeteners, and dairy solids.
- Labour Cost and Availability: With regional processing plants reporting turnover rates exceeding 25%, businesses are incurring substantial overtime and onboarding expenses.
- Retailer Private-Label Competition: Major supermarket chains continue expanding private-label product lines, forcing brand owners to maintain competitive pricing while absorbing upstream supply chain cost increases.
Macro Economic Snapshot: Australian Food & Grocery Sector
To understand where capital expenditure is delivering the highest return, let us examine the benchmark metrics across the sector:
| Industry Benchmark Metric | 2024 Baseline | 2026 Current Data | Growth / Trend |
|---|---|---|---|
| Total Industry Turnover | $162.4 Billion | $182.6 Billion | +12.4% |
| Processed Food Exports | $44.8 Billion | $52.6 Billion | +17.4% |
| Total Direct Employment | 276,000 | 301,000+ | +9.1% |
| Annual Capital Expenditure (CapEx) | $3.88 Billion | $4.50 Billion | +16.0% |
| Average Plant Gross Margin | 22.4% | 18.2% | -4.2% (Compression) |
| 2030 Industry Growth Target | $250.0 Billion | $250.0 Billion | Strategic Goal |
Source: Compiled from AFGC State of the Industry Reports, ABARES Agricultural Export Data, and ABS Manufacturing Statistics.
Where Capital Investment ($4.5B) Is Flowing in 2026
With $4.5 Billion invested into plant modernization across Australia, progressive food manufacturers are prioritizing operational tech that delivers immediate cash-flow recovery. Rather than committing to multi-million dollar greenfield facility builds, plant managers are focusing on targeted high-ROI upgrades:
1. Digital Yield Variance Tracking
Traditional food processing facilities frequently suffer from "invisible giveaway"—the subtle over-filling of batch ingredients or under-reporting of floor waste. Implementing automated batch weighing and real-time recipe scale integration eliminates human error at the mixing stage. If an operator over-dispenses expensive cocoa butter or functional proteins by just 1.5% per batch, an average facility bleeds upwards of $140,000 annually in direct raw material costs.
By utilizing dedicated tools like Batchbase Recipe Costing Software, production teams instantly compare target formula costs against actual floor usage, identifying yield discrepancies before batches are finalized.
2. Onsite Energy & Heat Recovery Retrofits
Because industrial refrigeration and steam boilers swallow up to 80% of total energy draw in dairy, meat, and ready-to-eat (RTE) plants, manufacturers are installing Variable Speed Drives (VSDs) on ammonia chillers and capturing waste heat from pasteurization loops to pre-heat washdown water.
3. Automated Quality & Specification Management
Relying on physical paper binders and static Excel spreadsheets for Product Information Forms (PIFs) and spec sheets creates severe compliance bottlenecks. When raw material specifications change—such as an alternative supplier providing emulsifiers with different moisture levels—quality assurance teams must instantly update batch formulations. Discover how centralized digital specification management streamlines compliance in our guide to Central Spec Sheet Hub Features.
Operational Blueprint: 5 Steps to Lock in Margins Against the AFGC 2030 Target
To align with the AFGC's growth vision while protecting plant margins today, executive leadership teams should execute the following operational roadmap:
Step 1: Conduct a Line-Level Waste Audit
Quantify physical mass balance across every unit operation—from raw intake to packaging. Differentiate between unpreventable process shrinkage and operational waste caused by improper equipment calibration.
Step 2: Transition from Static to Live Recipe Costing
Replace monthly retrospective cost accounting with live recipe margin tracking. Link raw material purchase orders directly to production bill of materials (BOMs) so price spikes trigger immediate margin alerts.
Step 3: Standardize Specification Management Across Co-Makers
If contract manufacturers (co-makers) produce SKUs on your behalf, enforce strict digital specification control to prevent unauthorized ingredient substitutions that alter nutritional panels or allergen declarations.
Step 4: Optimize Batch Production Scheduling
Reduce Clean-In-Place (CIP) frequency and energy-intensive start-up cycles by optimizing batch sequencing. Schedule non-allergenic or light-colored product runs sequentially before deep-clean allergen changeovers.
Step 5: Lock in Export Traceability Protocols
Ensure export-bound finished goods possess complete parent-child lot traceability. International customs authorities increasingly demand digital proof of provenance within hours of arriving at port.
Conclusion: Turning Industry Challenges into Competitive Advantage
The Australian food manufacturing sector's path to $250 Billion by 2030 will not be paved by maintaining status-quo operations. While external factors like wholesale energy prices and national transport tariffs remain largely beyond individual plant control, internal manufacturing precision is 100% controllable.
By digitizing recipe formulations, automating spec sheet compliance, and maintaining real-time visibility over raw material yield, Australian food processors can successfully defend their margins against inflation and capture growing global market share.
Ready to digitize your factory's recipe costing and spec management? Request a live Batchbase demo today and see how mid-tier Australian manufacturers are protecting their bottom line.